
Author: Miriam Reviewed by: Ryan Rusu
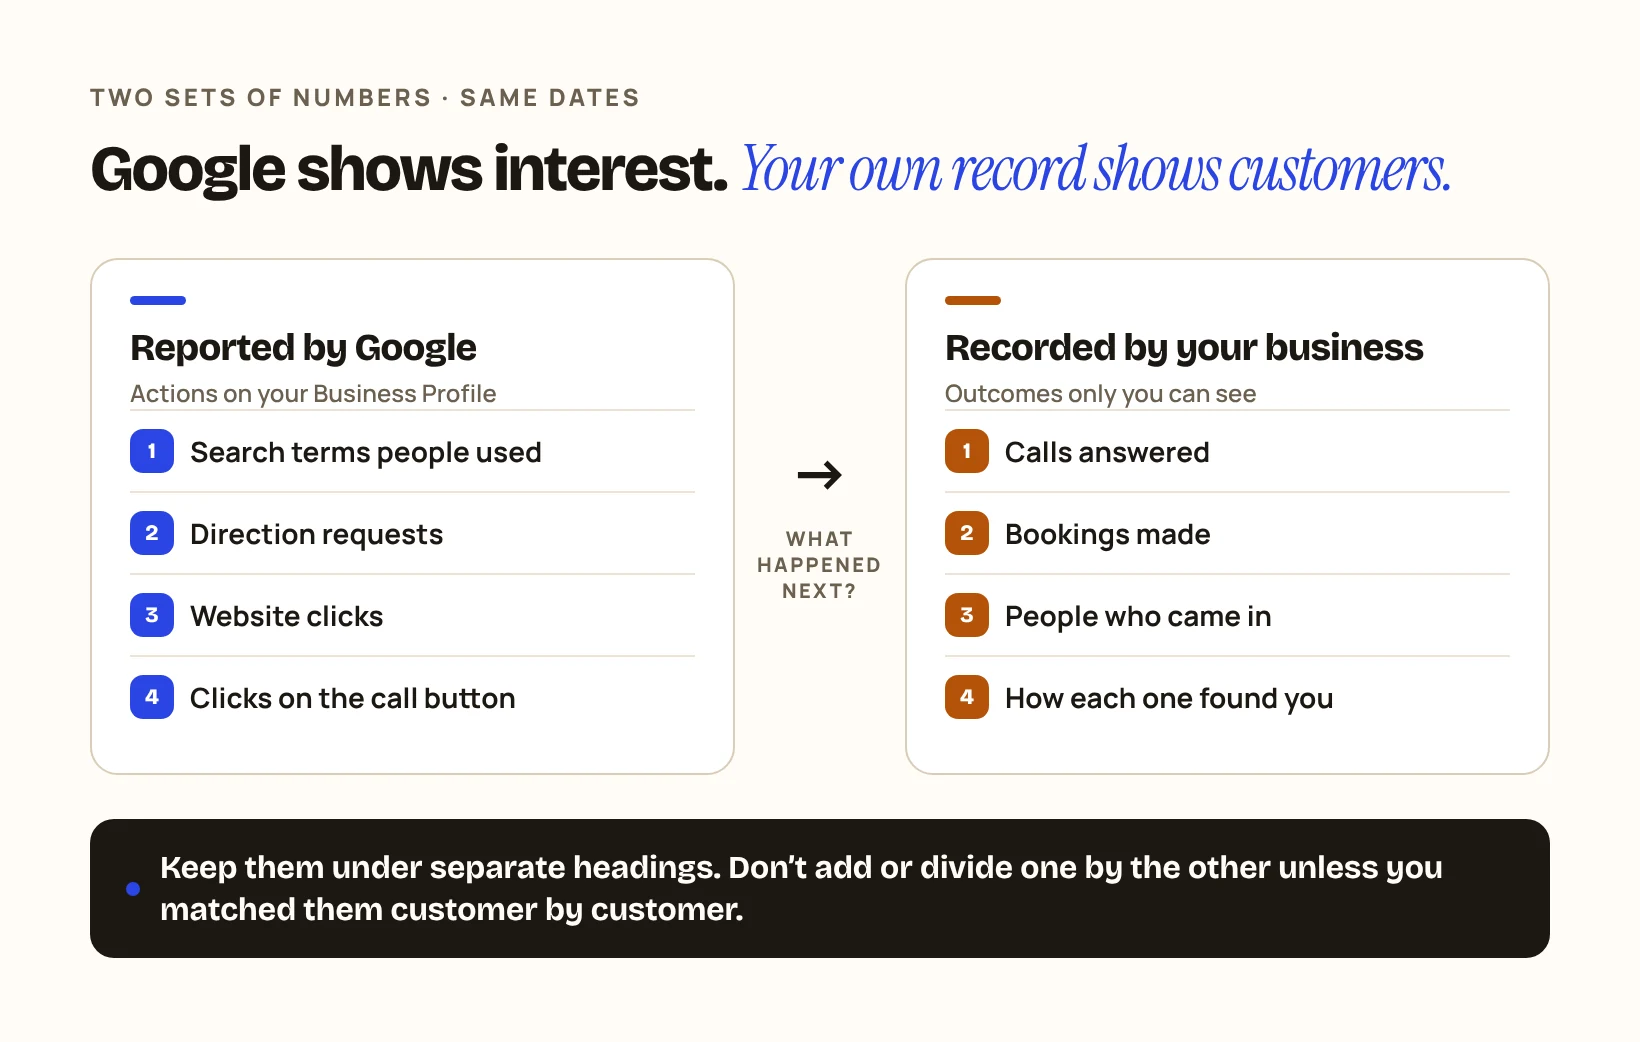
The numbers in your Google Business Profile show that people found you and took a step towards you. They do not show that anyone became a customer. To know that, you need a second set of numbers that only your business can record: calls answered, bookings made and people who came in.
This guide explains what Google reports, what it leaves out, and a simple way to record the rest. The example is a made-up car repair garage in Dubai.
Illustrative example · fictional figures. It is not a DIGIO report and it does not show any client’s results.
1What does Google show you?
Google shows how people found your profile and what they did there. Its help page on Business Profile performance says the data covers how customers use Search and Maps to find your profile and the actions they take once they do.
The metrics it lists include:
| Metric | What Google counts |
|---|---|
| Searches | The search terms people used to find your business |
| Directions | How many people asked for directions to your business |
| Website clicks | Clicks on the website link in your profile |
| Calls | Clicks on the call button in your profile |
Other interactions, such as messages or bookings, appear only when they apply to your business. Google adds that performance data is available only for verified profiles, and that you can set a date range to look at a period of time.
Check it yourself: On Google Search, open your Business Profile, click Performance and set the time period to last month. Write down the figures for calls, directions and website clicks.
2What do those numbers leave out?
They leave out what happened next. Each figure counts an action on Google, not an outcome in your business.
| Google reports | It does not tell you |
|---|---|
| Someone asked for directions | ✕Whether they arrived |
| Someone clicked the website link | ✕Whether they booked or bought |
| Someone clicked the call button | ✕Whether the call was answered, or what it was about |
| A search term showed your profile | ✕Whether that person needed your service |
Check it yourself: Pick one figure from last month, for example directions. Ask yourself what you would need to know to turn it into a number of customers. That is the gap your own record has to fill.
3What can only your business record?
Only your business can record answered calls, bookings and visits, and where each one came from. The simplest method is one question, asked every time: “How did you find us?”
In the example, the garage keeps a sheet at reception with one row per new customer and four columns: date, what they needed, how they found the garage (Google or Maps, Instagram, recommendation, other), and whether the job went ahead. “Google or Maps” is ticked only when the customer says so. That answer is the rule the business uses to classify the customer.
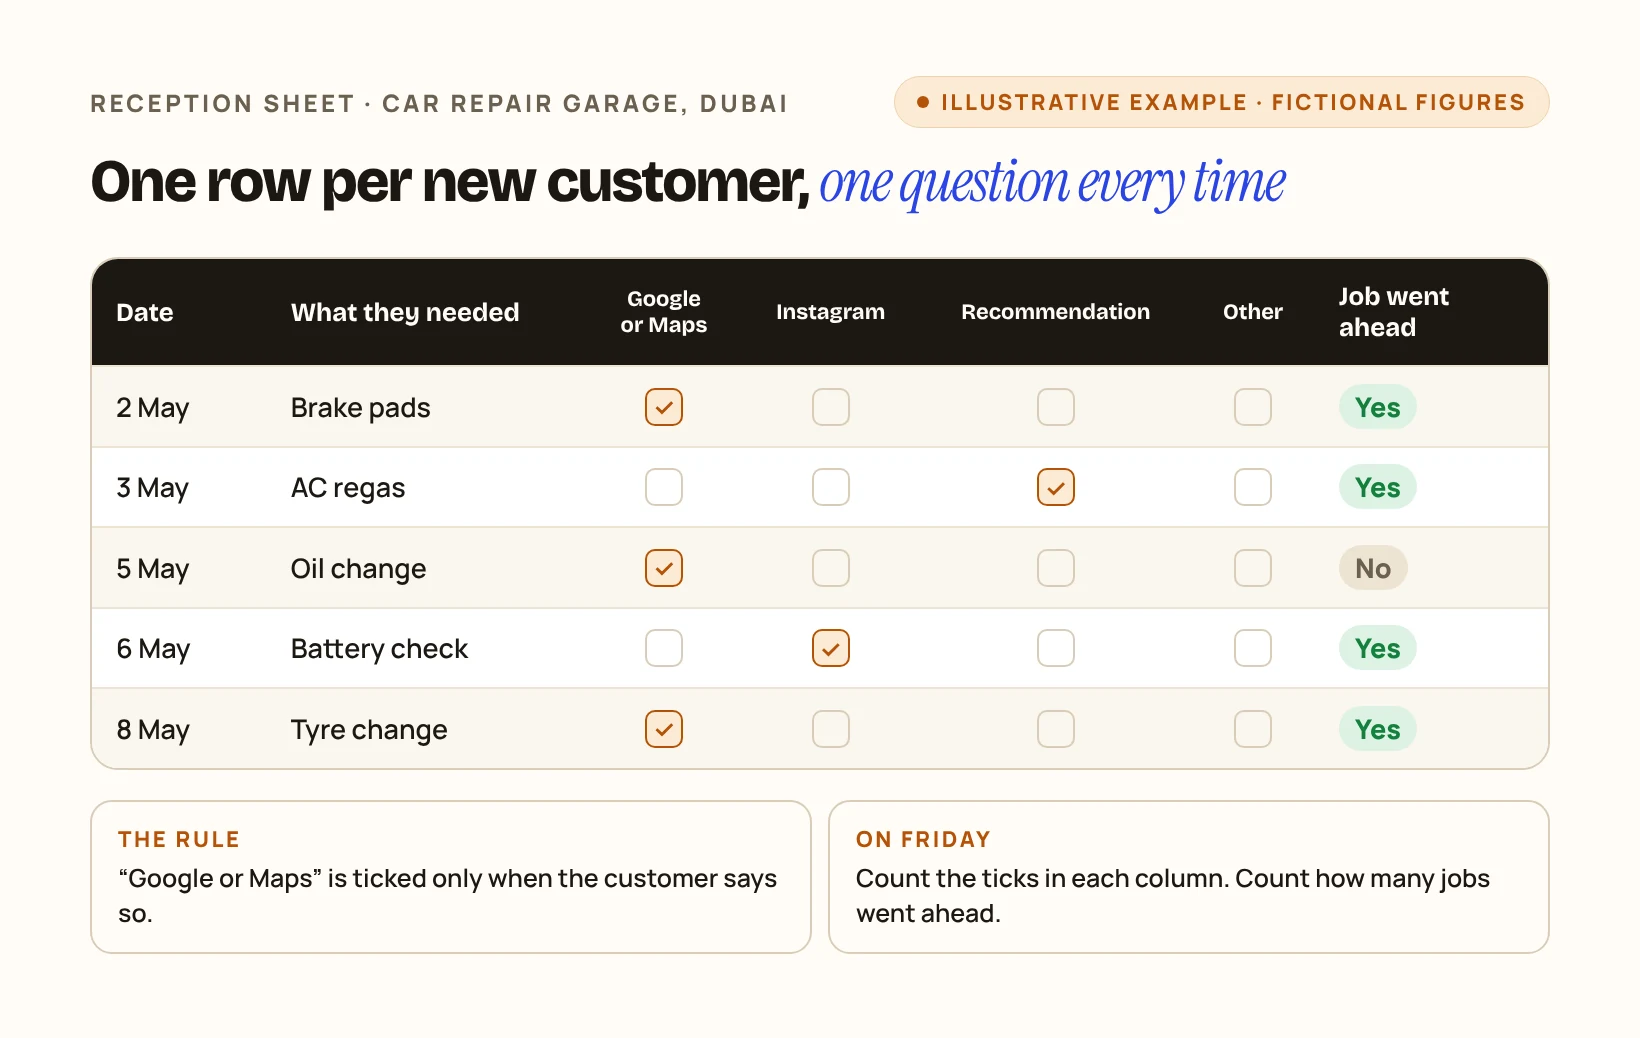
Check it yourself: For one week, ask every new caller and visitor how they found you and tick the answer. Count the ticks on Friday.
4Put the two sets of numbers side by side
Show both in the same report, under separate headings, for the same dates. Do not add them together or divide one by the other unless you have matched them customer by customer.
| The garage, one month | May |
|---|---|
| Reported by Google | |
| Calls from the profile (clicks on the call button) | 120 |
| Direction requests | 85 |
| Website clicks | 140 |
| Recorded by the business | |
| New customers who said they found the garage on Google or Maps | 46 |
| Of those, jobs completed and paid as of 15 June | 29 |
The two halves of the table come from different sources and were not matched. The example does not say which of Google’s 120 calls became any of the 46 customers. What the owner can say is narrower and still useful: 46 new customers named Google or Maps in May, and 29 of them had paid for a job by 15 June.
Check it yourself: Take your Google figures and your own sheet for the same month. Put them in two blocks like the table above. If your own block is empty, you are judging your local visibility on Google’s half alone.
5How should I read a change from one month to the next?
Compare the same metric over periods of the same length, and look at your own record before you draw a conclusion. A rise in direction requests with no change in customers who name Google is a different story from a rise in both.
One practical detail: Google says the searches metric is updated at the start of each month and can take up to five days to appear. Early in the month, last month’s search terms may not be there yet.
Check it yourself: When an agency reports that calls or directions went up, ask what your own record shows for the same dates.