Author: Ryan Rusu Edited by: Miriam
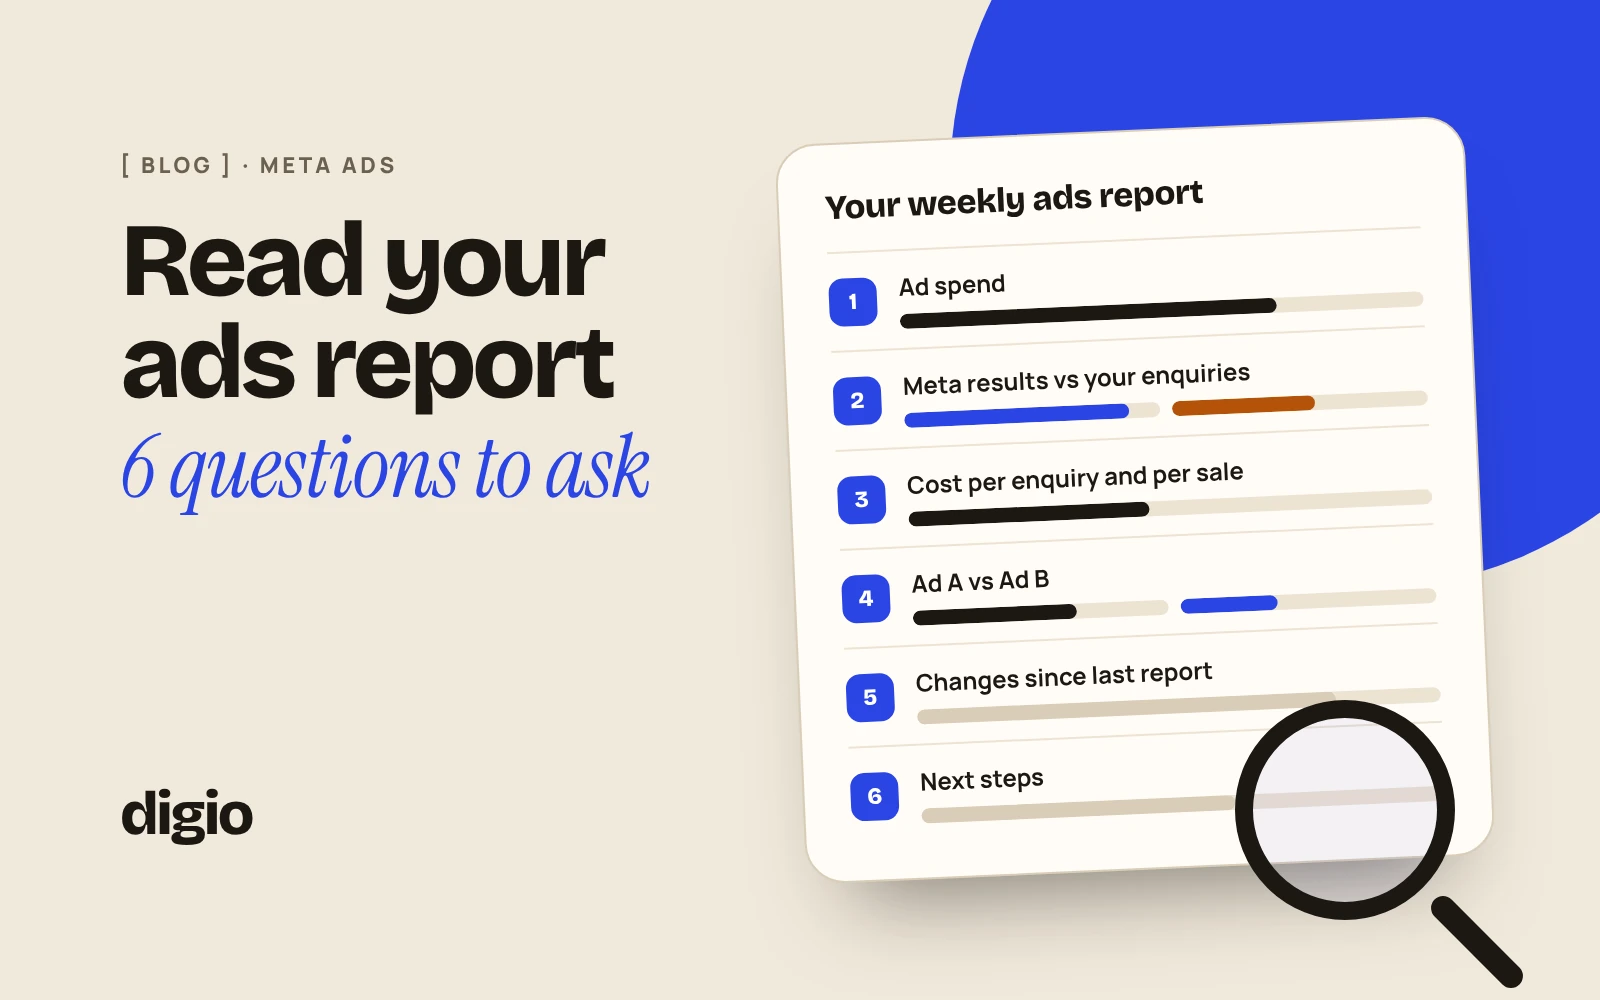
A good Meta ads report, the one your agency sends for Facebook and Instagram, shows five things: what you spent on ads, what Meta counted as a result, what your business recorded, what was changed, and what happens next. If your report shows only impressions, reach and clicks, it describes activity. It doesn’t tell you whether the ads are bringing you customers.
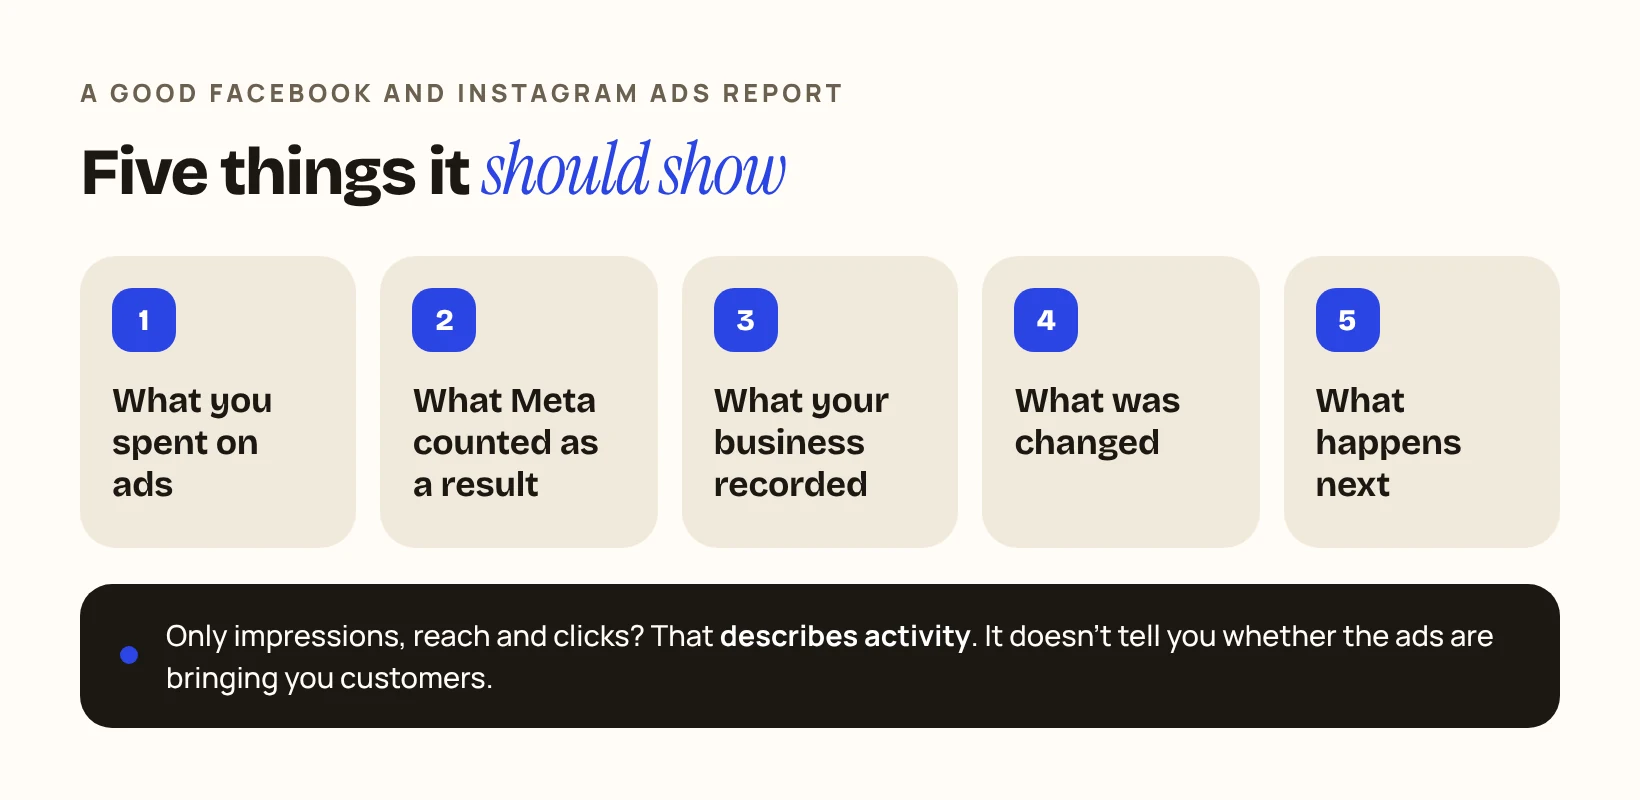
You don’t need to understand Ads Manager to check this. Ask the six questions below. Each one starts with a short answer and ends with a check you can do yourself.
To make the numbers concrete, one example runs through the article: a made-up home-cleaning company in Dubai that ran one campaign with two ads that open a WhatsApp chat. The report covers one week, 1 to 7 March. Jobs are counted up to a cut-off date of 21 March.
Illustrative example · fictional figures. It is not a DIGIO report and it does not show any client’s results.
After the six questions, a further section shows a real DIGIO weekly report, anonymised, checked against the same questions, including what it does not show.
1How much did we spend, and on what?
The report should show the ad spend for the exact dates it covers, split by campaign, with the goal of each campaign next to it. Without the goal, the spend means little: a campaign built to start WhatsApp chats and one built to sell on a website are judged by different numbers.
Ad spend is the cost of the ads during the reporting dates, as shown in the ad account. It does not include the agency’s fee. Don’t try to read it off your card statement: card payments are not broken down by campaign or by the report’s dates.
In the example, ad spend from 1 to 7 March was AED 2,100, all on one campaign whose goal was WhatsApp conversations.
Check it yourself: ask for the ad spend of each campaign between the report’s start and end dates, and check that the campaign figures add up to the total shown.
2How many results does Meta report, and how many did my business record?
A report should show both numbers and keep them apart, because they come from different sources and count different things. Meta’s number says what happened on Meta. Your own number says what your business recorded.
In Ads Manager, Results is the number of times an ad achieved the outcome the campaign was set up for. For ads that open a chat, Meta’s help centre lists a metric called Messaging conversations started. A chat that started is not yet an enquiry about a service you offer, and it is not a customer.
Meta also applies its own rules to decide which actions it credits to an ad. It calls this the attribution setting. You don’t need the detail to read a report. You need to know which setting your campaigns use, and to expect that Meta’s figures and your own records will not match exactly.
In the example there are two separate counts:
The company built its count like this. In this fictional example, each ad promoted its own named offer, and each offer appeared only in that ad and nowhere else. When someone wrote in, the person answering WhatsApp logged the date, the phone number, the service requested and the offer the customer mentioned. The offer mentioned is the rule the business uses to classify an enquiry under Ad A or Ad B. An enquiry was logged as identified only when the customer named one of the two offers and asked about a service the company provides. This is the business’s own classification. The two counts were not matched chat by chat, so the example says nothing about the conversations the business did not identify. The step-by-step method is in how to see which ad brought each WhatsApp chat.
Other terms you will see in a report describe how the ads were shown and clicked. They help explain a result. They are not the result. The definitions below follow Meta’s help centre.
| Term | What it means |
|---|---|
| Impressions | The number of times your ads were on screen. The same person can count several times |
| Reach | The number of Meta accounts that saw your ads at least once. Meta says this is an estimate |
| Frequency | The average number of times each account saw your ad. Also an estimate |
| CTR (link click-through rate) | Link clicks divided by impressions, shown as a percentage |
| CPM | Cost per 1,000 impressions |
| ROAS | Sales Meta attributes to the ads divided by ad spend |
Check it yourself: ask your agency which result each campaign is counting and which attribution setting it uses. Then count your own enquiries for the same dates. If you have no way to count them, that is the first thing to set up.
3What did each real enquiry or sale cost?
Divide the ad spend by the outcomes your business recorded, as well as by the results Meta counted. The three figures answer different questions, and a report should show all of them with clear labels.
Meta’s Cost per result divides the amount spent by the number of results. You can do the same division with your own numbers, as long as the spend and the outcomes belong to the same campaign and the same enquiries.
A cleaning job is rarely done and paid in the week the customer first writes, so the company followed that week’s enquiries forward:
A job counts for this report only if its enquiry is one of those 38. Jobs that came from older enquiries, from another campaign or from a recommendation are left out, even if they were done in the same week. Enquiries still open on 21 March are not counted as jobs, so the figure can rise if the company looks again later. That is why the cut-off date is written next to the number.
| Campaign, 1–7 March | |
|---|---|
| Ad spend | AED 2,100 |
| Messaging conversations started (reported by Meta) | 60 |
| Cost per result (reported by Meta) | AED 35 |
| Tracked enquiries (identified by the business) | 38 |
| Ad spend per tracked enquiry | about AED 55 |
| Completed and paid jobs from those enquiries, as of 21 March | 9 |
| Ad spend per completed and paid job, as of 21 March | about AED 233 |
The same AED 2,100 gives three different figures, depending on what you divide by. The last two are ad spend only. They do not include the agency’s fee or the time spent answering chats.
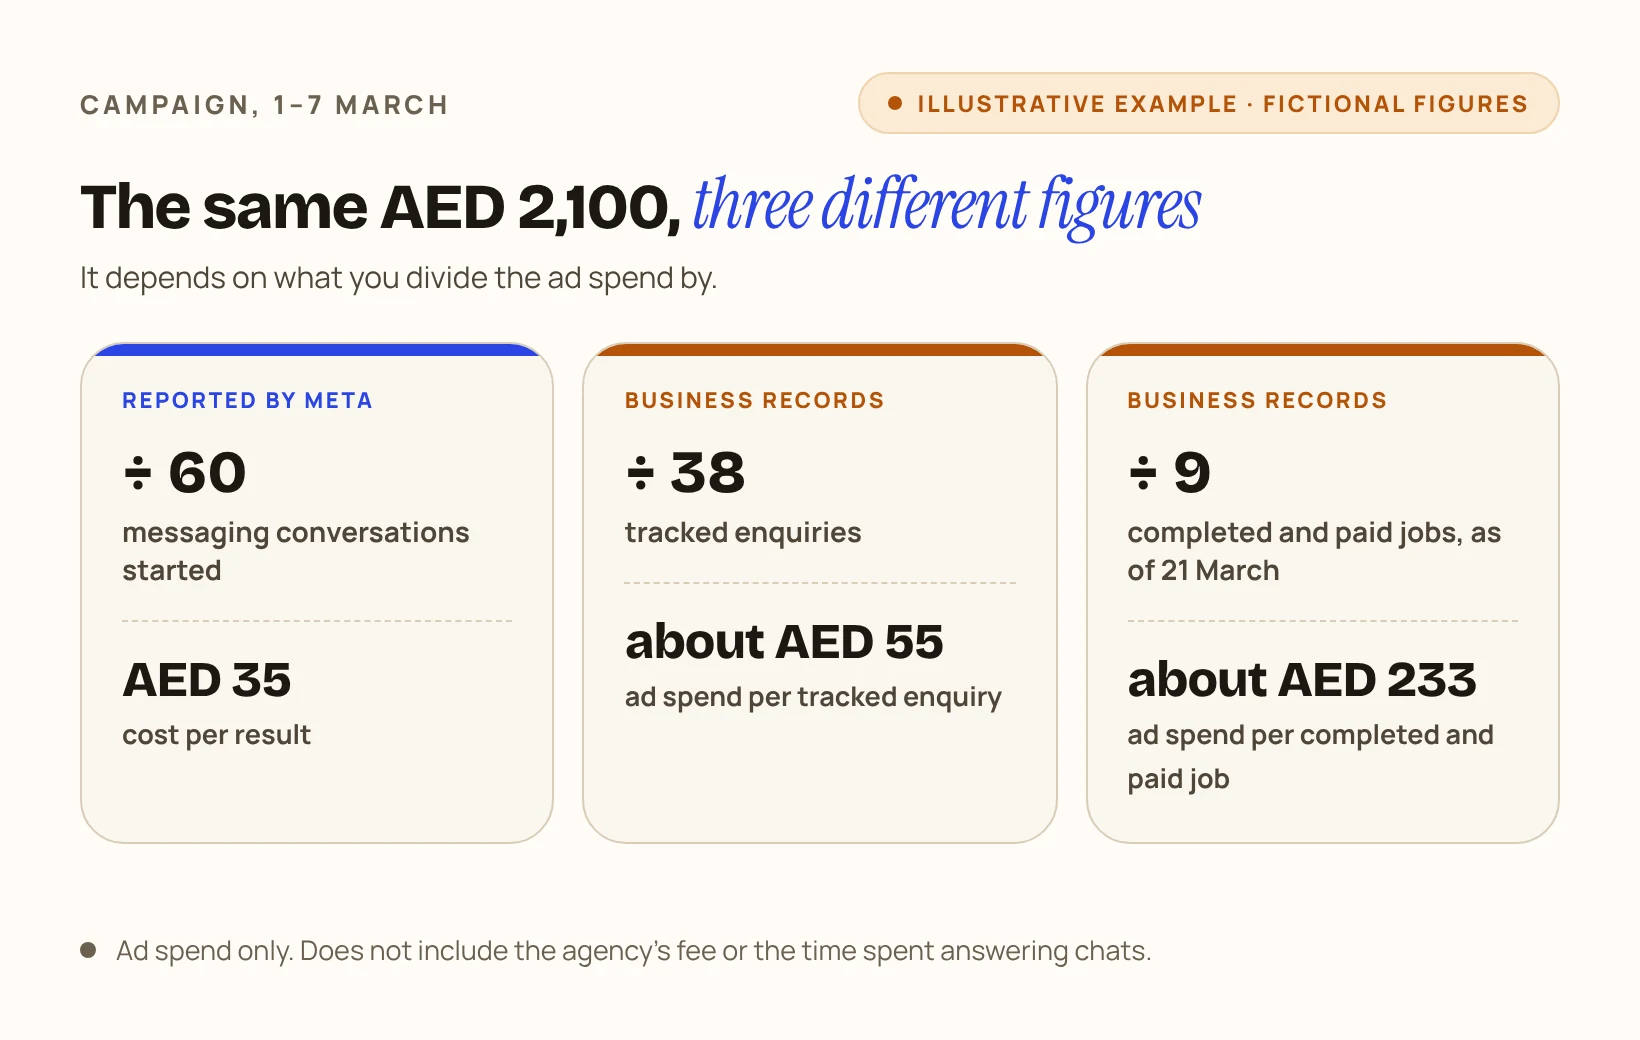
Check it yourself: take one campaign and the report’s dates. Count the enquiries you logged for that campaign in those dates. Pick a cut-off date and count how many of those same enquiries are completed and paid by then. Divide that campaign’s ad spend for the period by each number. Don’t divide by every job you finished that week: some came from earlier enquiries or from other campaigns.
4Which ad did better, and is there enough data to say so?
Compare ads on the outcome closest to money that you can record for that campaign’s goal, and treat the answer as provisional when it rests on few outcomes. A report should say which number it used for the comparison and how many outcomes stand behind it.
Which number to use depends on what the campaign is for:
| Campaign goal | Compare ads on | Rather than |
|---|---|---|
| WhatsApp or Messenger chats | ✓Tracked enquiries and ad spend per tracked enquiry; completed jobs if you can link them | ✕Clicks or chats started |
| Lead forms | ✓Leads you managed to reach and who wanted the service | ✕Number of forms |
| Website sales | ✓Purchases and their value against ad spend, checked against your own orders | ✕Clicks or add-to-carts |
| Awareness | ✓People reached and how often | ✕Sales |
Compare only ads that share the same goal and the same dates. If the campaign uses a lead form and the leads look weak, start with four things to check when Meta lead forms bring bad leads.
In the example, the two ads look like this:
| Ad A | Ad B | |
|---|---|---|
| Ad spend, 1–7 March | AED 1,200 | AED 900 |
| Messaging conversations started (Meta) | 36 | 24 |
| Cost per result (Meta) | about AED 33 | about AED 38 |
| Tracked enquiries | 20 | 18 |
| Ad spend per tracked enquiry | AED 60 | AED 50 |
| Completed and paid jobs, as of 21 March | 3 | 6 |
| Ad spend per completed and paid job, as of 21 March | AED 400 | AED 150 |
On Meta’s cost per result, Ad A has the lower figure. On the company’s own records, Ad B is the ad with the lower observed cost in the example, both per tracked enquiry and per completed and paid job.
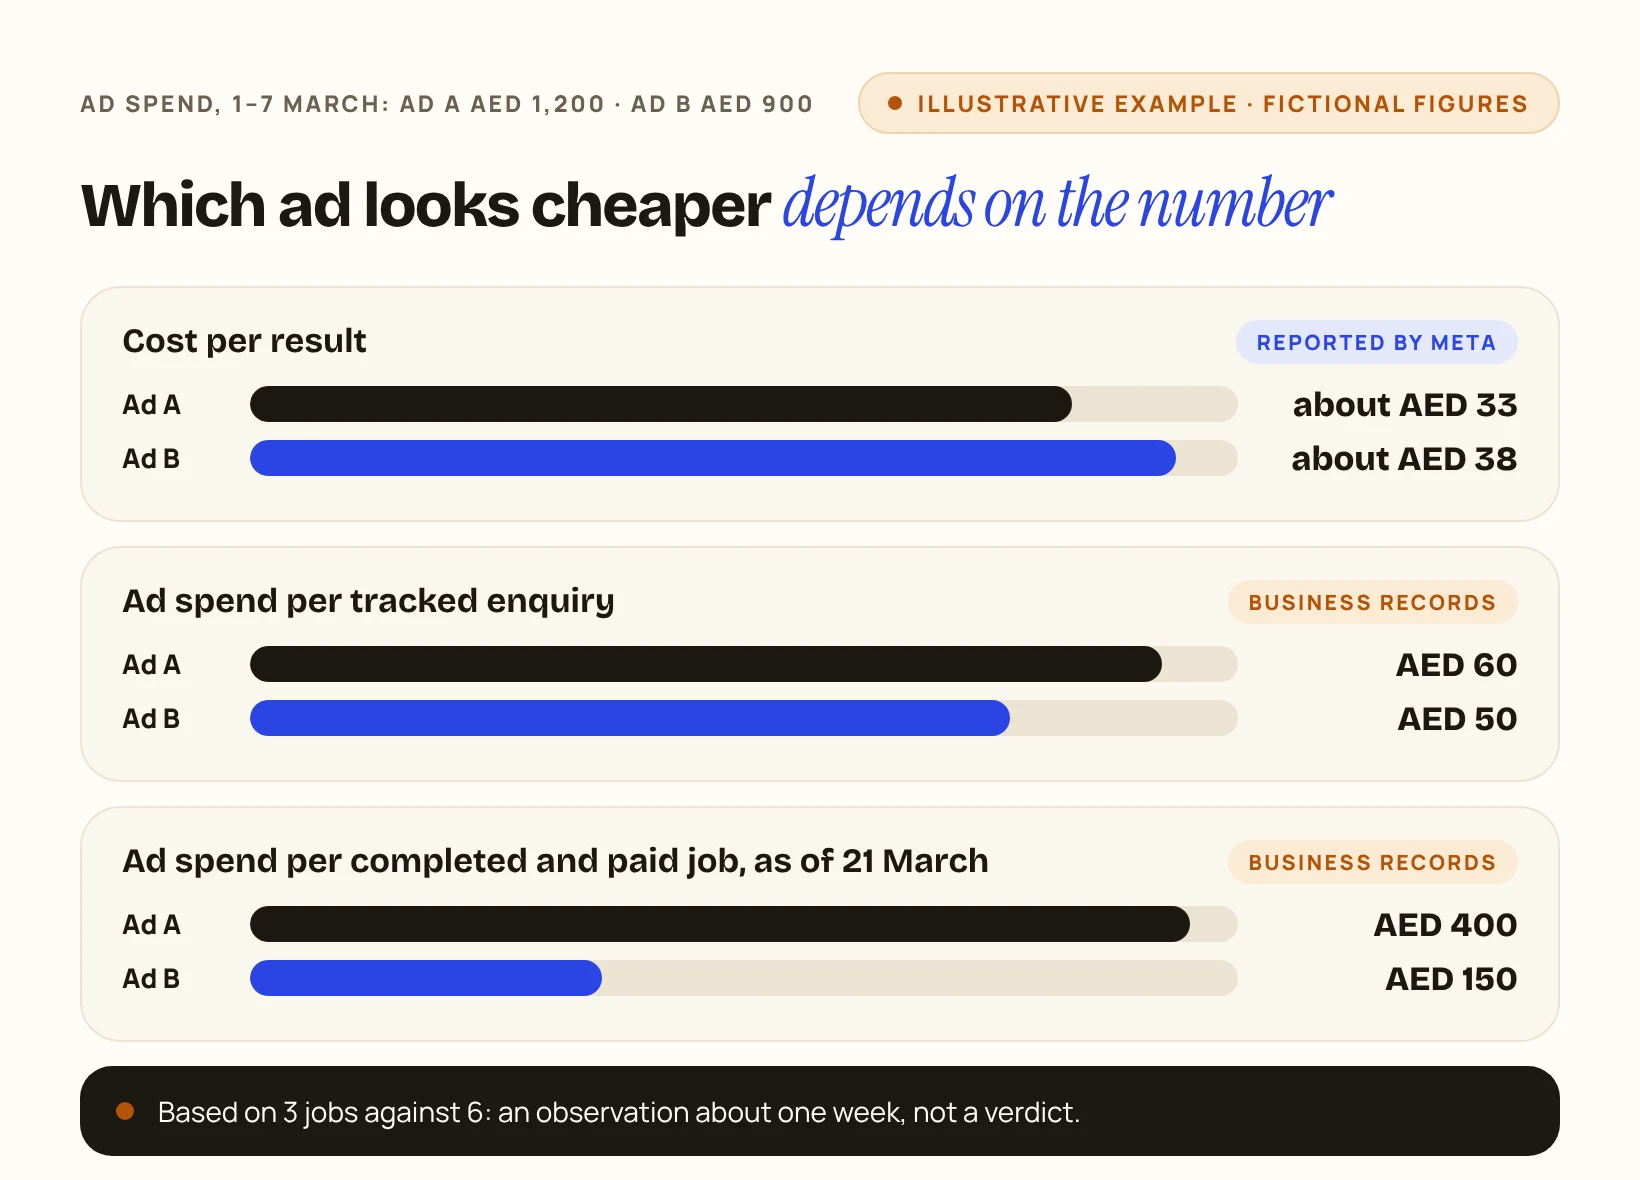
That is an observation about one week, not a verdict. The difference rests on 3 jobs against 6, and the example does not show why the two ads differed. With so few jobs, the reasonable reading is that Ad B had the lower observed cost so far, and that more weeks of the same record are needed before deciding anything.
Check it yourself: when your agency says one ad is better, ask “better on which number, and how many of them?” If the answer is clicks, or a difference of a few sales, treat it as an early signal.
5What did you change since the last report, and why?
A report should list each change with its date and its reason: new ads, paused ads, budget moves, audience changes. Without that list, you cannot tell which numbers were recorded before a change and which after.
Meta’s help centre describes an activity history in Ads Manager that tracks the changes made to campaigns, ad sets and ads. Your agency can use it to produce this list.
In the example, the report would state that both ads started on the first day of the week and that no other edits were recorded.
Check it yourself: ask for the list of changes with dates. If you have access to your ad account, open the activity history for the same period and see whether the two match.
6What will you do next, and what do you need from me?
A report should end with one or two specific actions, each with an owner and a date, and with anything the agency needs from you. Numbers without a decision are a description, not management.
In the example, the next steps could be: keep both ads running for another week, keep the same enquiry log, and review the two ads again with two weeks of completed and paid jobs. From the owner: make sure every enquiry is logged with the offer the customer mentioned.
Check it yourself: look at the first lines of your next report. They should say whether last week’s actions were done.
What does a real DIGIO weekly report look like?
Here’s how a real DIGIO weekly report measures up against the six questions, including what it leaves out. Below is the Meta Ads part of a weekly report DIGIO sent to a client during the first week of its Black Friday campaigns. The client’s name is removed and campaign names are replaced with descriptions. The report was sent in euros. Amounts are shown here in dirhams, with the original euro figure in brackets.
Real DIGIO report · client anonymised. An online store in Europe that sells on its own website. Week of 2–8 November 2026. Sales are those attributed by Meta. Not a result from the UAE.
AED amounts are converted at €1 = AED 4.20, the rate checked on 18 November 2026, and rounded. Percentages and ROAS are the same in either currency.
The report’s main reading: ad spend rose by 22% and purchases and attributed sales rose by about the same proportion, so the cost of each sale barely moved.
| 2–8 Nov | 26 Oct–1 Nov | |
|---|---|---|
| ROAS (sales attributed by Meta ÷ ad spend) | 23.6 | 23.2 |
| Cost per purchase (ad spend ÷ purchases) | about AED 73.5 (€17.49) | about AED 73.6 (€17.52) |
You can redo both figures: AED 232,810 ÷ AED 9,845 ≈ 23.6, and AED 9,845 ÷ 134 ≈ AED 73.5. ROAS here is ad spend only, against sales Meta attributes; it does not include the agency’s fee, product costs or returns.
The report then splits the spend by campaign:
| Campaign | Ad spend | Purchases (Meta) | ROAS (Meta) |
|---|---|---|---|
| Sales · main video campaign | AED 3,725 (€887) | 69 | 33.8 |
| Sales · second campaign | AED 2,927 (€697) | 32 | 15.8 |
| Black Friday NEW | AED 1,100 (€262) | 14 | 28.9 |
| Sales · older campaign (paused) | AED 1,025 (€244) | 6 | 11.4 |
| Black Friday · second market | AED 462 (€110) | 7 | 16.0 |
| Premium product line | AED 340 (€81) | 1 | 2.0 |
| Wholesale · second market | AED 147 (€35) | 0 | — |
| Wholesale · sales rep | AED 113 (€27) | 5 | 78.1 |
The report rounds spend to the euro, so the campaign lines add up to €2,343 against the €2,344 total. After conversion and rounding they add up to AED 9,839 against AED 9,845. The purchases add up to 134.
This is how the report lines up with the six questions:
| Question | What the real report shows |
|---|---|
| 1 · Spend | AED 9,845 (€2,344) for 2–8 November, the previous 7 days for comparison, and a line per campaign. The goal shows in each campaign name: sales, Black Friday or wholesale. |
| 2 · Meta vs business | Purchases and sales are labelled as attributed by Meta, in the figures and in the footer. The store’s own order count is not in this report. |
| 3 · Cost per sale | Cost per purchase and ROAS for this week and the previous week, so you can see whether higher ad spend made each sale dearer. |
| 4 · Which did better | Purchases and ROAS per campaign. The new Black Friday campaign is called “the candidate for more budget” after one week and 14 purchases. |
| 5 · Changes | Ad spend up 22%, a new Black Friday campaign and one older campaign paused. Named for the week, not dated one by one. |
| 6 · Next steps | Three actions: more budget for two campaigns, review the second sales campaign, post on Mondays and weekends. No owner or date next to each. |
Measured by this article’s own questions, two points need care. We show them because they are the same checks you should apply to any report, ours included:
Check it yourself: put your own last report next to the table above. For each of the six questions, find the line that answers it. Where you find none, that is the question to ask your agency this week.
If your report can’t answer these questions
Ask your agency for: